


The medical-dermatological demographics favors health planning and guides expansion of the specialty. We conducted an ecological study of dermatologists members of the Brazilian Society of Dermatology (SBD). We evaluated: gender, age, address; which were compared with population and human development index indicators of municipalities. We evaluated 8384 members, distributed in 527 (9.5%) municipalities throughout Brazil. The female sex represented 78.4% of the members and the median age was 43 (36-54) years. The median density of dermatologists was 0.35 (0.21-0.37) per 10,000 inhabitants. The correlation (Spearman’s rho) between density of dermatologists and human development index was 0.39 (p <0.01). The Brazilian dermatologist is characterized as: female, age <50 years and presenting an heterogeneous distribution throught the country.
The demand of the population for dermatological assistance is not well-defined and varies between countries, according to structures of health services and the type of service provided.1–3 Brazilian public health system (SUS) functions with a professional planning of 0.12/10,000 dermatologists/inhabitants with the goal of meeting the secondary demand in general dermatology and leprology. Stratified, high quality public health systems such as in England function with an expectancy of 0.1/10,000 inhabitants.4
As surgical, aesthetic, dermatological subspecialties (for example, dermoscopy, pediatrics or phototherapy), teaching and research procedures are incorporated to clinical services, a higher professional demand is expected. In the USA, there is some consensus regarding the density of 1 dermatologist for every 25,000 inhabitants (0.4/10,000 inhabitants).1,2
Brazil is a country with continental dimensions and with a great variety of demographic, climatic and social development, what results in different priorities for dermatological health, such as skin cancers and psoriasis in the South and Southeast regions, Hansen’s disease in the Mid-West and North and American tegumentary leishmaniasis in the Northeast.4,5 Besides, the density of physicians and dermatologists in Brazil also correlates to the human development index (HDI).6
The Brazilian Society of Dermatology (SBD) is the second largest dermatology society in the world, with more than 8,000 members. Dermatology training encompasses, after medical school, a minimum of three years of residency or post-graduation with an accredited curriculum by the SBD. Currently, SBD recognizes 81 accredited services for the training of dermatologists. To become a full member applicants must have been approved in the Brazilian Society Board examination to obtain the title of specialist in dermatology. Full members, residents (aspiring) and non-full members, i.e., those who had dermatology training in services accredited by the SBD but did not do or were not approved in the specialist title exam, are considered associate members.
The investigation of the medical-dermatological demographics favors health planning and indicates potentially favorable areas for the growth of the specialty, standardizing dermatology coverage in the country.7
The objective of this study is to evaluate the geographical distribution and demographics of SBD members in Brazil.
MethodsThis is an ecological study with associate dermatologists, according to SBD’s registry updated in May, 2017, anonymously given to the researchers. The unit of the sample is each of the 5,570 Brazilian municipalities.
The variables studied were gender, age and municipality of registry of the associate dermatologists of the SBD (2017), that were compared to population indexes (2016) and HDI (2010) of the Brazilian municipalities.8,9
Categorical variables were represented by percentages. Quantitative data were submitted to Shapiro-Wilk normality test and represented as mean and standard deviation or median and quartiles (p25–p75), according to the indication. The correlation between variables was tested using the Spearman’s rank correlation coefficient.10,11
The population in the municipalities was assessed in relation to the SBD’s registry of dermatologists and to the region of the country with a generalized linear model, with the distribution of probability, range, Log-likelihood and robust covariance matrix. Post hoc analysis was performed by the sequential Sidak method. Model adjustment was based on the Akaike information criterion (AIC).
Global spatial autocorrelation measures were estimated by the index I of Moran, the local indicators of spatial association (LISA) were used to estimate regions with different patterns of high or low clustering.12 The degree of spatial dependency pondered was of up to 2 neighboring municipalities (Queen method).
Statistical significance was defined as p < 0.01.10
Data were tabulated in MS Excel and analyzed by IBM SPSS 22 and GeoDA 1.8 softwares.13,14
ResultsAccording to the Brazilian Institute of Geography and Statistics (IBGE), it is estimated that the population of the 5,570 Brazilian municipalities represent around 206 million inhabitants, but only 1,402 (25.2%) municipalities have more than 25,000 inhabitants. However, their population represents almost 166 million people, or 80.5% of the country’s population.
In this study we evaluated all 8,384 associate dermatologists of the SBD. We verified that they are distributed in only 527 (9.5%) of the 5,570 Brazilian municipalities. The country’s mean density of dermatologists is 0.41 professionals for 10,000 inhabitants; however, when only the municipalities that have dermatologists licensed by the SBD are considered, the median (p25–p75) professional density is 0.35 (0.21–0.37), as shown in figure 1.
 in the 527 municipalities that have dermatologists registered with the SBD. The remaining 5043 Brazilian municipalities, that do not have dermatologists, have a density of zero.")
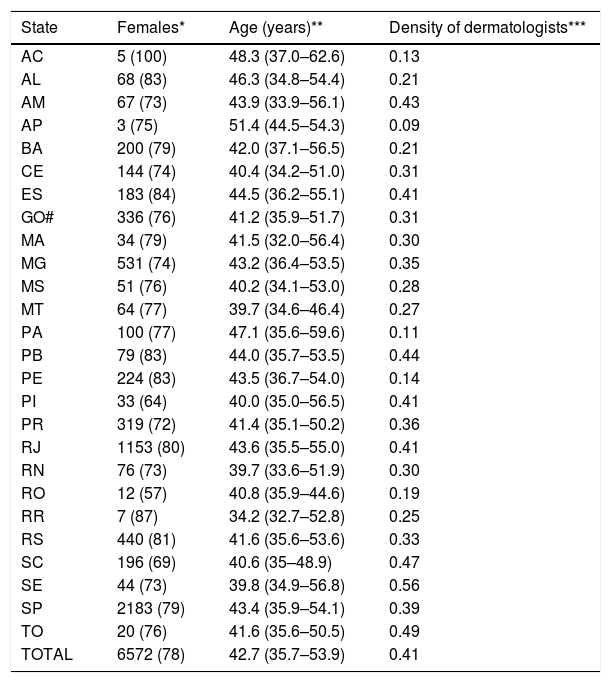
The main demographic data of the associates are shown in table 1 and figure 2. We highlight an age group of under 52 years of age (72%) and prevalence of females (78.4%), especially among dermatologists under 60 years of age. The minimum and maximum registered ages of the dermatologists are 27 years and 87 years.
Table 1: Main demographics and population density of the associates of the SBD according to Brazilian states in 2017 (n = 8384)
| State | Females* | Age (years)** | Density of dermatologists*** |
|---|---|---|---|
| AC | 5 (100) | 48.3 (37.0–62.6) | 0.13 |
| AL | 68 (83) | 46.3 (34.8–54.4) | 0.21 |
| AM | 67 (73) | 43.9 (33.9–56.1) | 0.43 |
| AP | 3 (75) | 51.4 (44.5–54.3) | 0.09 |
| BA | 200 (79) | 42.0 (37.1–56.5) | 0.21 |
| CE | 144 (74) | 40.4 (34.2–51.0) | 0.31 |
| ES | 183 (84) | 44.5 (36.2–55.1) | 0.41 |
| GO# | 336 (76) | 41.2 (35.9–51.7) | 0.31 |
| MA | 34 (79) | 41.5 (32.0–56.4) | 0.30 |
| MG | 531 (74) | 43.2 (36.4–53.5) | 0.35 |
| MS | 51 (76) | 40.2 (34.1–53.0) | 0.28 |
| MT | 64 (77) | 39.7 (34.6–46.4) | 0.27 |
| PA | 100 (77) | 47.1 (35.6–59.6) | 0.11 |
| PB | 79 (83) | 44.0 (35.7–53.5) | 0.44 |
| PE | 224 (83) | 43.5 (36.7–54.0) | 0.14 |
| PI | 33 (64) | 40.0 (35.0–56.5) | 0.41 |
| PR | 319 (72) | 41.4 (35.1–50.2) | 0.36 |
| RJ | 1153 (80) | 43.6 (35.5–55.0) | 0.41 |
| RN | 76 (73) | 39.7 (33.6–51.9) | 0.30 |
| RO | 12 (57) | 40.8 (35.9–44.6) | 0.19 |
| RR | 7 (87) | 34.2 (32.7–52.8) | 0.25 |
| RS | 440 (81) | 41.6 (35.6–53.6) | 0.33 |
| SC | 196 (69) | 40.6 (35–48.9) | 0.47 |
| SE | 44 (73) | 39.8 (34.9–56.8) | 0.56 |
| SP | 2183 (79) | 43.4 (35.9–54.1) | 0.39 |
| TO | 20 (76) | 41.6 (35.6–50.5) | 0.49 |
| TOTAL | 6572 (78) | 42.7 (35.7–53.9) | 0.41 |
.")
The density of dermatologists in the municipalities with registered professionals has a significant correlation with the HDI rate (rho = 0.39 IC95% 0.30–0.47; p < 0.01), especially HDI-Income (rho = 0.43 IC95% 0.35–0.51; p < 0.01), but also to HDI-Longevity (rho = 0.23 IC95% 0.14–0.31; p < 0.01) and HDI-Schooling (rho = 0.32 IC95% 0.23–0.39; p < 0.01). We highlight 371 (6.7%) Brazilian municipalities with more than 25,000 inhabitants and HDI > 0.67 (considered medium-high) that have no dermatologist licensed by the SBD (Figure 3).
 in 2010 5570 Brazilian municipalities (Moran’s I = 0.74; p < 0.01).")
In regards to the population of the municipalities, the registered associates were concentrated in the most populated units (p < 0.01), with a variable concentration between the regions (p < 0.01): in the South region, there were more dermatologists in municipalities with a smaller population when compared to the North, Northeast and South-East regions; the Midwest region did not differ from the others (Figure 4).
 in the different regions of Brazil. The dotted line indicates the cut-off of the population: 25,000 inhabitants.")
The geographical distribution of Brazilian municipalities according to population and density of SBD dermatologists is represented in figures 5 and 6. Of note, 931 (16.7%) municipalities with more than 25,000 inhabitants do not have a dermatologist licensed by SBD and 295 municipalities have licensed dermatologists with a density lower than 0.4/10.000 inhabitants.
.")
 for every 10,000 inhabitants in the 5570 Brazilian municipalities (Moran’s I = 0.06; p < 0.01).")
Moran’s I index for the distribution of densities of dermatologists (0.06; p < 0.01) indicates the presence of geographical clusters (spatial dependency) of the concentration of professionals.
Figure 7shows the regions highlighted by the analysis of spatial association (LISA), indicating clusters of higher and lower density of SBD dermatologists (DMT) in comparison to the populations (POP) of the municipalities and to the HDI (Figure 8). Of note, 235 municipalities in regions with a low-density of dermatologists in relation to the larger population (p < 0.01) and 494 municipalities with the high HDI in proportion to a lower density of dermatologists (p < 0.01).
 related to the density of dermatologists of the SBD (DMT) and to the population (POP) of the 5570 Brazilian municipalities. Municipalities with significantly higher (>) or lower (<) DMT and POP.")
 related to the density of dermatologists of the SBD (DMT) and to the human development index (IDH) of the 5570 Brazilian municipalities. Municipalities with significantly higher (>) or lower (<) DMT and IDH.")
SBD dermatologists have a young profile with female predominance and a heterogeneous geographical distribution, centered in the metropolitan areas. Various municipalities with a population and density of professionals able to accommodate an increase in the number of SBD associate dermatologists are identified.
In the last decade, SBD’s growth happened in a rate of more than 300 members per year (4% to 5% of the SBD), what is marked in comparison to the more modest increase in the Brazilian population (1% to 2%). These aspects make the understanding of the geographical distribution of dermatologists in Brazil important, in order to better distribute as to guarantee work demand, reduction in competition and occupy possible areas to prevent the progress of non-certified professionals or the action of paramedics in skin health.15
Regarding other physicians in Brazil, their distribution also has features of metropolitan, heterogeneous and uneven growth in the different regions. In general, the number of physicians also grows quicker than the general population, but the uneven distribution remains. Physicians’ median age has been decreasing (45.7 years), with a prediction of staying in professional activities for long time, besides the fact that younger people are more productive and cover more the demands of care from the specialty. Despite the tendency of a higher female contribution among the new physicians, the proportion of women (54.8% according to SBD’s registry in 2014) it is still considerably lower than the one seen in dermatology.16
The expansion of the dermatological practice, especially in some fields as surgery and aesthetic, in adittion to the population’s greater access to health (both public and private) allows to resize the recommendation about the number of professionals demanded per inhabitant.17 Examples from Brazil and USA show cities with more than 1 dermatologist per 10,000 inhabitants, especially metropoles, probably due to demands on sub-specialists and participation in educational institutions.
Our results confirm the association of higher professional densities and municipalities with a higher HDI, highlighting that the quality of life, chance of better payment and possibility of family development are important elements for the professional to establish in the municipality. This is evident because between the HDI sub-divisions, income (Income-HDI) and schooling (Schooling-HDI) were more strongly associated to the density of dermatologists.6
The study of the local indicators reveals many areas with a potential for professional expansion of the specialty (higher population, higher HDI and lower density of dermatologists). We must observe the indication of neighboring municipalities, where an itinerant dermatologic coverage can be organized by dermatologists settled (and registered) in the regional capital, even though the model ponders the influence of up to 2 neighboring municipalities.
This study has limitations related to the methodology, as the reference of only one municipality of care per associate; the possibility of non-updated records; the existence of professionals that work in management positions, political representation and sub-specialties or even resident physicians and retirees; and the lack of consideration of the numerical dimension of the assistance of each professional in the context of the public health system. However, this survey serves as background to know the associate profile, the heterogeneity of the geographical distribution and the possible areas in need of a specialized skin health care, since a better dermatologic coverage is associated to a lower morbidity and mortality of skin conditions.18,19
In the same way, there are dermatologists that are not associated to SBD and other medical (and non-medical) professionals that practice dermatology without a specialist title. The municipal density of the other Brazilian physicians, however, correlates with the density of dermatologists (rho = 0.86) in the cities where there is a registry of SBD dermatologists.6,20
Subsequent studies that sample the strength of dermatological assistance (associated or not to SBD) that help estimate the dimension of the different types of assistance (public, group and solo private practices), the profile of the assistance (clinical, surgical, aesthetic) and the longitudinal analysis of the geographical distribution are necessary for a strategic growth planning of the SBD and subspecialties.
ConclusionThe profile of the Brazilian dermatologist is predominantly characterized by females, younger than 50 years of age, with a heterogeneous distribution in the country, with a tendency of a higher concentration in more populated municipalities as well as a higher HDI.
Financial support: Brazilian Society of Dermatology.
Conflict of interest: none.