


Acne vulgaris (AV) is an immunoinflammatory dermatosis of the sebaceous glands (SG), inter-adnexal epithelium (IE) and hair follicles (HF); it shows lipid synthesis and cytokine expression by microorganism-cell interaction. In AV, toll-like receptors type 2 (TLR2) and 4 (TLR4), nucleotide oligomerization domain-like, type 1 (NOD1) and 2 (NOD2) and peroxisome proliferator-activated receptor gamma (PPARG) regulate the SG expression, cell differentiation and macronutrient metabolism.1 Dietary fatty acids (FAs) seem to influence AV through the imbalance of omega-3 and -6 FAs.2 Our hypothesis is that supplementation with gamma linolenic (GLA), linoleic (AL) and oleic (OA) acids, with or without lymecycline (LM), interferes with the expression of TLR1, TLR2, NOD1, NOD2, and PPARG in AV.
The present research was an open, prospective, randomized, non-placebo-controlled study, approved by the Research Ethics Committee of Pontifícia Universidade Católica de Campinas (PUC-Campinas; protocol n.387/09) and Faculdade de Medicina da Universidade de São Paulo (FMUSP; 229/10), at the Dermatology Service at PUC-Campinas; FMUSP Department of Dermatology; Experimental Pathology Laboratory of Universidade Federal do Rio Grande do Sul (UFRGS); and the Postgraduate Program in Health Sciences at Instituto de Assistência Médica ao Servidor Público Estadual (IAMSPE) in São Paulo, resulting in the Doctorate theses of the first and last authors. Financial support was provided by Fundo de Apoio da Sociedade Brasileira de Dermatologia (Funaderm) and a donation of LM (Tetralysal®, 300 mg) and GLA/LA/OA (Tiliv L, 1000 mg; 480 mg/day, 1200 mg/day and 510 mg/day, respectively, of GLA/LA/OA) by Galderma Brasil Ltda., São Paulo, SP, Brazil, and Arese Pharma Ltda., Valinhos, SP, Brazil, respectively.
Forty-five male patients with papulopustular or cystic acne, aged between 13 and 38 years, read, understood, signed the free and Informed Consent Form and were randomized into three therapeutic groups (1:1:1) for 90 days: Group 1, LM 300 mg/day; Group 2, GLA/LA/OA 1000 mg/day; or Group 3, Group 1+Group 2. Papules, pustules and cysts were counted at Visits 1, Day 0 (D0); 2, D30; 3, D60; and 4, D90. A biopsy of the papulopustular lesion was performed on D0 and D90 for immunohistochemical analysis of TLR1, TLR2, NOD1, NOD2, and PPARG, evaluated by three pathologists using the following grading score: non-existent (0), weak (1), medium (2) and strong (3).
The means obtained before and after treatment were compared between groups and lesions. Quantitative variables were described by mean and standard deviation, comparing those with a symmetrical distribution by analysis of variance (ANOVA), followed by Tukey’s posthoc; intergroup evaluation was carried out with the Kruskal-Wallis test for non-parametric data; and intragroup evaluation with Wilcoxon test. Descriptive statistics were used, with standard deviation, minimum, maximum , and median values, with a significance level of 5% (p < 0.05) using the statistical package IBM SPSS version 20.
Of the 45 subjects, 36 (80%) completed the study: 11 from Group 1; 13 from Group 2; and 12 from Group 3. There was no statistical difference between the groups (p = 0.626). The ratio of subjects with papulopustular and cystic acne was similar for Groups 1, 2 and 3, and there were no differences regarding phototypes (p = 0.548) and time of disease evolution (p = 0.959; Table 1).
Characteristics of subjects with AV included in the study.
| Variables | Groups of treatment | p-value | ||
|---|---|---|---|---|
| Group 1 (n = 11) | Group 2 (n = 13) | Group 3 (n = 12) | ||
| Age (years) | 0.626 | |||
| Mean(SD) | 17.5 (3.9) | 17.7 (4.7) | 19.6 (6.2) | |
| Median (Min–Max) | 17 (13 – 28) | 16.5 (16 – 31) | 17 (15 – 38) | |
| AV degree | 0.327 | |||
| Papulopustular | 9 (81.8) | 11 (84.6) | 10 (83.3) | |
| Cysts | 2 (18.2) | 2 (15.4) | 2 (16.7) | |
| Phototype | 0.548 | |||
| II | 3 (27.2) | 3 (23.1) | 3 (25) | |
| III | 4 (36.4) | 2 (15.4) | 3 (25) | |
| IV | 4 (36.4) | 8 (61.5) | 6 (50.0) | |
| Time of disease (years) | 0.959 | |||
| Mean (SD) | 5.3 (2.8) | 5.6 (3.6) | 6.4 (4.4) | |
| Median (Min–Max) | 4.5 (2 – 12) | 4.5 (2 – 15) | 5.0 (3 – 18) | |
SD, Standard Deviation; Min, Minimum; Max, Maximum; n, Number; p, Probability of observing a result as extreme or more extreme than that of the sample, assuming that the null hypothesis is true; AV, Acne Vulgaris.
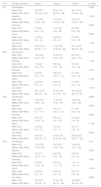
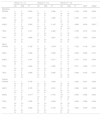
A significant decrease was observed in the number of comedones and cysts throughout the study (p < 0.001), with no difference between the groups and no alterations in comedones and cysts. The pustules decreased significantly (p < 0.001), with no effect of time, difference between the groups (p = 0.049; Table 2). However, the papules and total AV lesions varied between the study groups (p = 0.049 and p = 0.011; group*Visit interaction; Table 2). There was a decrease in comedones and pustules in all groups and visits when compared to D0, except between D60 and D90 (p = 0.966). For the cysts, there was a decrease, except from D30 on (Table 3).
Descriptive statistics of lesions according to group and time of treatment.
| Visit | Number of lesions | Group 1 | Group 2 | Group 3 | p-value |
|---|---|---|---|---|---|
| D0 | Comedones | 0.328 | |||
| Mean (SD) | 18.4 (5.7) | 23.2 (10.7) | 25.5 (13.0) | ||
| Median (Min–Max) | 18.5 (12 – 29) | 23.0 (5 – 38) | 27.0 (5 – 46) | ||
| Papules | 0.162 | ||||
| Mean (SD) | 11.3 (4.9) | 13.6 (4.6) | 14.3 (7.3) | ||
| Median (Min–Max) | 9.5 (6 – 22) | 12.0 (8 – 25) | 12.0 (6 – 35) | ||
| Pustules | 0.290 | ||||
| Mean (SD) | 7.3 (4.9) | 10.1 (5.4) | 9.4 (6.5) | ||
| Median (Min–Max) | 8 (2 – 18) | 9 (3 – 22) | 8 (2 – 26) | ||
| Cysts | 0.496 | ||||
| Mean (SD) | 1.0 (2.0) | 0.4 (0.9) | 2.9 (5.5) | ||
| Median (Min–Max) | 0 (0 – 6) | 0 (0 – 3) | 0 (0 – 16) | ||
| Any lesion | 0.156 | ||||
| Mean (SD) | 38.0 (14.5) | 47.2 (16.4) | 52.1 (23.0) | ||
| Median (Min–Max) | 38 (20 – 71) | 41.5 (24 – 83) | 49 (18 – 99) | ||
| D30 | Comedones | 0.175 | |||
| Mean (SD) | 14.8 (4.6) | 18.9 (8.7) | 20.3 (9.1) | ||
| Median (Min–Max) | 14 (8 – 22) | 18 (4 – 32) | 22 (3 – 33) | ||
| Papules | 0.156 | ||||
| Mean (SD) | 7.3 (4.2) | 9.5 (3.4) | 8.1 (5.3) | ||
| Median (Min–Max) | 7 (2 – 16) | 9 (4 – 16) | 7 (3 – 24) | ||
| Pustules | 0.374 | ||||
| Mean (SD) | 3.8 (3.5) | 5.6 (3.0) | 5.4 (4.4) | ||
| Median (Min–Max) | 3 (0 – 10) | 5.5 (1 – 11) | 4 (0 – 15) | ||
| Cysts | 0.160 | ||||
| Mean (SD) | 0.3 (0.9) | 0.0 (0.0) | 1.5 (3.5) | ||
| Median (Min–Max) | 0 (0 – 3) | 0 (0 – 0) | 0 (0 – 12) | ||
| Any lesion | 0.142 | ||||
| Mean (SD) | 26.1 (10.3) | 33.9 (14.0) | 35.4 (15.3) | ||
| Median (Min–Max) | 26.5 (10 – 49) | 31.5 (12 – 57) | 36 (12 – 67) | ||
| D60 | Comedones | 0.296 | |||
| Mean (SD) | 12.8 (4.0) | 17.5 (9.0) | 15.6 (6.6) | ||
| Median (Min–Max) | 13 (8 – 20) | 16 (4 – 33) | 16 (3 – 26) | ||
| Papules | 0.009 | ||||
| Mean (SD) | 5.1 (2.5) | 8.9 (3.7) | 5.1 (3.9) | ||
| Median (Min–Max) | 5 (1 – 10) | 8.5 (3 – 15) | 5 (0 – 16) | ||
| Pustules | 0.022 | ||||
| Mean (SD) | 2.6 (1.9) | 5.6 (3.2) | 2.4 (2.9) | ||
| Median (Min–Max) | 3.5 (0 – 5) | 5 (1 – 12) | 1 (0 – 8) | ||
| Cysts | 0.149 | ||||
| Mean (SD) | 0.0 (0.0) | 0.0 (0.0) | 0.6 (1.7) | ||
| Median (Min–Max) | 0 (0 – 0) | 0 (0 – 0) | 0 (0 – 6) | ||
| Any lesion | 0.060 | ||||
| Mean (SD) | 20.4 (6.7) | 31.9 (12.9) | 23.8 (10.6) | ||
| Median (Min–Max) | 22.5 (9 – 27) | 32.5 (13 – 55) | 25.5 (7 – 43) | ||
| D90 | Comedones | 0.19 | |||
| Mean (SD) | 11.8 (3.8) | 16.7 (8.0) | 13.4 (6.3) | ||
| Median (Min–Max) | 12 (6 – 20) | 14 (5 – 30) | 12 (3 – 25) | ||
| Papules | 0.003 | ||||
| Mean (SD) | 4.5 (2.7) | 8.4 (4.2) | 3.8 (2.3) | ||
| Median (Min–Max) | 3.5 (1 – 10) | 9 (3 – 18) | 3 (0 – 8) | ||
| Pustules | 0.003 | ||||
| Mean (SD) | 2.2 (2.6) | 6.2 (4.1) | 1.6 (1.7) | ||
| Median (Min–Max) | 1.5 (0 – 9) | 7 (1 – 13) | 1 (0 – 4) | ||
| Cysts | <0.001 | ||||
| Mean (SD) | 0.0 (0.0) | 0.0 (0.0) | 0.6 (1.7) | ||
| Median (Min–Max) | 0 (0 – 0) | 0 (0 – 0) | 0 (0 – 6) | ||
| Any lesion | 0.006 | ||||
| Mean (SD) | 18.4 (6.5) | 31.4 (11.6) | 18.8 (9.0) | ||
| Median (Min–Max) | 18.5 (8 – 27) | 36 (11 – 48) | 18.5 (6 – 32) |
SD, Standard Deviation; Min, Minimum; Max, Maximum; n, Number; p, Probability of observing a result as extreme or more extreme than that of the sample, assuming that the null hypothesis is true.
Multiple comparisons of numbers of lesions at the visits for the treatment groups.
| Lesion | Comparison | Estimated mean difference | Standard Error | p-value |
|---|---|---|---|---|
| Comedones | D0 vs. D30 | 4.450 | 0.674 | <0.001 |
| D0 vs. D60 | 7.175 | 1.095 | <0.001 | |
| D0 vs. D90 | 8.500 | 1.232 | <0.001 | |
| D30 vs. D60 | 2.725 | 0.556 | <0.001 | |
| D30 vs. D90 | 4.050 | 0.748 | <0.001 | |
| D60 vs. D90 | 1.325 | 0.368 | 0.005 | |
| Pustules | D0 vs. D30 | 4.000 | 0.473 | <0.001 |
| D0 vs. D60 | 5.425 | 0.669 | <0.001 | |
| D0 vs. D90 | 5.625 | 0.916 | <0.001 | |
| D30 vs. D60 | 1.425 | 0.434 | 0.012 | |
| D30 vs. D90 | 1.625 | 0.702 | 0.113 | |
| D60 vs. D90 | 0.200 | 0.429 | 0.966 | |
| Cysts | D0 vs. D30 | 0.850 | 0.224 | 0.001 |
| D0 vs. D60 | 1.225 | 0.301 | <0.001 | |
| D0 vs. D90 | 1.450 | 0.352 | <0.001 | |
| D30 vs. D60 | 0.375 | 0.224 | 0.341 | |
| D30 vs. D90 | 0.600 | 0.301 | 0.197 | |
| D60 vs. D90 | 0.225 | 0.224 | 0.747 |
D30, 30 days of study; D60, 60 days of study; D90, 90 days of study; p, Probability of observing a result as extreme or more extreme than that of the sample, assuming that the null hypothesis is true.
On immunohistochemistry, there was no difference between the groups and analyzed histopathological sites on D0. On D90, there was a NOD2 difference in the IE between the Groups (Group 1 with higher values than Groups 2 and 3). The median of NOD2 in the IE was two in the three groups, with a maximum value in Group 1 surpassing the others, indicating a somewhat higher distribution of values in Group 1. In the intragroup comparisons, there was a decrease in PPARG in SG in Group 2 (p = 0.016) and a significant increase in NOD2 in HF in Group 1 (p = 0.011; Table 4).
Comparative table between and within groups for the assessment by the score.
| Group 1 (n = 11) | Group 2 (n = 13) | Group 3 (n = 12) | |||||||||
|---|---|---|---|---|---|---|---|---|---|---|---|
| D0 | D90 | Pc | D0 | D90 | Pc | D0 | D90 | Pc | PD0d | PD90d | |
| Epithelium | |||||||||||
| PPARG | 2 (0–3) | 2 (0–3) | 0.603 | 2 (0–3) | 1 (0–3) | 0.088 | 3 (0–3) | 1 (0–3) | 0.184 | 0.340 | 0.482 |
| NOD1 | 3 (2–3) | 3 (2–3) | 0.317 | 3 (2–3) | 3 (1–3) | 0.480 | 3 (1–3) | 3 (1–3) | 0.180 | 0.797 | 0.177 |
| NOD2 | 2 (1–3) | 2 (2–3)a | 0.063 | 2 (0–3) | 2 (1–2)b | 0.102 | 1.5 (0–3) | 2 (1–2)b | 0.999 | 0.500 | 0.001d |
| TRL2 | 2 (0–3) | 2 (1–3) | 0.317 | 1 (1–3) | 2 (0–3) | 0.480 | 1 (1–3) | 1 (0–3) | 0.739 | 0.370 | 0.794 |
| TRL4 | 1 (0–3) | 1 (0–2) | 0.999 | 1 (0–3) | 1 (0–3) | 0.627 | 1 (0–3) | 1 (0–3) | 0.720 | 0.404 | 0.503 |
| Gland | |||||||||||
| PPARG | 2 (1–3) | 2 (1–3) | 0.180 | 2 (2–3) | 2 (0–3) | 0.016c | 2 (1–3) | 2 (1–3) | 0.132 | 0.146 | 0.091 |
| NOD1 | 2 (1–3) | 2 (1–3) | 0.366 | 2 (1–3) | 2 (0–3) | 0.589 | 2 (1–3) | 2 (2–3) | 0.096 | 0.696 | 0.197 |
| NOD2 | 2 (0–3) | 2 (1–3) | 0.107 | 2 (0–3) | 2 (1–3) | 0.317 | 1 (1–2) | 2 (1–3) | 0.107 | 0.331 | 0.560 |
| TRL2 | 1 (0–3) | 1 (0–2) | 0.084 | 0 (0–3) | 1 (0–2) | 0.480 | 1 (0–2) | 1 (0–3) | 0.271 | 0.083 | 0.777 |
| TRL4 | 0 (0–2) | 0 (0–2) | 0.999 | 0 (0–2) | 0 (0–2) | 0.890 | 0 (0–3) | 1 (0–3) | 0.546 | 0.440 | 0.067 |
| Follicle | |||||||||||
| PPARG | 0 (0–3) | 1 (0–2) | 0.739 | 1 (0–3) | 0 (0–3) | 0.429 | 1 (0–2) | 1 (0–3) | 0.454 | 0.941 | 0.299 |
| NOD1 | 3 (1–3) | 3 (1–3) | 0.705 | 2 (0–3) | 2 (0–3) | 0.874 | 2 (0–3) | 2 (1–3) | 0.386 | 0.405 | 0.499 |
| NOD2 | 1 (0–2) | 2 (0–3) | 0.011c | 1 (0–2) | 1 (0–2) | 0.705 | 0.5 (0–1) | 1 (0–2) | 0.084 | 0.082 | 0.092 |
| TRL2 | 1 (0–3) | 1 (0–2) | 0.236 | 0 (0–3) | 1 (0–2) | 0.999 | 1 (0–1) | 1 (0–2) | 0.206 | 0.388 | 0.449 |
| TRL4 | 0 (0–2) | 1 (0–2) | 0.480 | 0 (0–2) | 0 (0–3) | 0.726 | 0.5 (0–3) | 1 (0–2) | 0.850 | 0.565 | 0.304 |
Data presented as median (minimum–maximum).
a,bDifferent letters represent statistically different distributions.
cWilcoxon test.
dKruskal Wallis test.
The reduction of inflammatory lesions in the Groups with LM undergoing treatment (Groups 1 and 3) was predicted, as it is one of the tetracyclines of choice in the management of inflammatory AV, with high skin penetration.3,4
Costa et al., in 2007, pointed out a clinical non-response with the use of GLA/LA/OA supplementation, compared to placebo, in AV, but a possible improvement in the SG size, seen in pre-and post-treatment biopsies.5 The present study, however, indicated a possible usefulness of GLA/LA/OA for comedones and cysts, confirming Rustin's remote assumptions.6
NODs are activated by bacterial muramyl peptidoglycans, combined or not with TLRs. Thus, the result observed in NOD2 may have come from the control of microorganism-mediated inflammation, as the overexpression of NOD2 reduces clonal proliferation.7,8
PPARG acts on sebocyte modulation. Its GLA/LA/OA-induced SG reduction may be the cause of the increase in lauric, myristic, and palmitic acids under equal therapy, suggesting the same role in NOD2-lowering effects in the IE.9
GLA/LA/OA were used In Groups 2 and 3. Therefore, we suggest that their administration causes PPARG reduction in sebocytes in Group 2 and NOD2 in the IE of both Groups 2 and 3, reinforcing the hypothesis of beneficial supplementation with GLA/LA/OA for comedonal and cystic AV.5–7 Therefore, FAs with great bactericidal potential could reduce the concentrations of Cutibacterium acnes and, thus, the expression of bacterium-activated receptors. Interestingly, isolated LM increased NOD2 labeling in HF, requiring further elucidative studies. As PPARG and NOD2 are inversely related to papules in Group 3, perhaps they can be recruited in the early stages of the dermatosis.
Therefore, it is concluded that daily administration of LM and/or GLA/LA/OA interferes with the pro-inflammatory markers in AV, and supplementation with GLA/LA/OA could be an adjuvant in the treatment of AV.
Financial supportThis publication was made possible with the support from Fundo de Apoio à Dermatologia (Funaderm) da Sociedade Brasileira de Dermatologia, Galderma Brasil Ltda., São Paulo, SP, Brazil, and Arese Pharma Ltda., Valinhos, SP, Brazil.
Authors’ contributionsClarissa Prati: Statistical analysis; approval of the final version of the manuscript; design and planning of the study; drafting and editing of the manuscript; collection, analysis, and interpretation of data; critical review of the literature.
Emily Ferreira Salles Pilar: Approval of the final version of the manuscript; collection, analysis, and interpretation of data; effective participation in research orientation.
Andre Cartel: Approval of the final version of the manuscript; collection, analysis, and interpretation of.
João Bayma Galvão Pitoni: Approval of the final version of the manuscript; collection, analysis, and interpretation of data.
Cidia Vasconcellos: Approval of the final version of the manuscript; effective participation in research orientation; critical review of the manuscript.
Adilson da Costa: Approval of the final version of the manuscript; design and planning of the study; drafting and editing of the manuscript; effective participation in research orientation; critical review of the manuscript.
Conflicts of interestNone declared.
Study conducted at the Instituto de Assistência Médica ao Servidor Público Estadual, São Paulo, SP, Brazil; Pontifícia Universidade Católica de Campinas, Campinas, São Paulo, SP, Brazil; and Hospital de Clínicas de Porto Alegreda Universidade Fedral do Rio Grande do Sul, Porto Alegre, RS, Brazil.